Tuesday 27 August 2019

EURUSD Roadmap Forecast in 1Hours Time Frame 2019

With smallest time frame based on last post, makes confused. Hahaha
Don't worry, I have the map from the bigger time frame.

So what's EURUSD in 1Hours looks?

EURUSD Roadmap Forecast 1Hours with ElliotWaves

Wow I can see the green as b, it's no need much time. Just wait until it end.
The Next step is wave (4), I think it's good if I open Sell in (4). Just wait until candle break the 50% fibonacci and take profit in wave B near 100% fibonacci. How do you think? Is it good for me to open Sell after waves (4)? I hope.. So, this is my roadmap forecast, how about yours?

Leave it in comment :)


See you next post

Roadmap Forecast EURUSD in 4Hours Chart 2019

As I share in last post, I'll show you how the daily chart looks in smallest time frame. Yes, in 4 hours.
As we have the big roadmap, it's no problem. Don't panic or confused.

Let's see the picture:

EURUSD Roadmap Forecast in 4Hours with Elliot Waves

From this, it's so complex but I can see the next is smallest sub waves (4). It needs b waves in green box to get the (4). Just wait until it goes to the red box (5). Because it's 4Hours Chart, maybe it takes 1 or 2 days to get (4).

Next is in 1Hours Time Frame.

EURUSD Roadmap Forecast Daily Chart 2019

Based on part2 I'll show you the daily chart from EURUSD pairs. More small the time frame, more complex the waves. In daily chart, it shows the real condition from weekly chart eurusd. Is it still longer to wait or no longer time needs to take the next waves in weekly chart. I can see it from here.

Look at this daily chart EURUSD 2019:

Daily Chart Roadmap Forecast eurusd 2019 with Elliot Wave 

When I see in daily chart, whe wave iii (or (v)) needs subwaves B, C(or iv) then will be goes to (v) or iii.
why after (iii) there's abc? because the waves (iii) needs 5 waves, then after 5 waves comes abc. So, for (iv) needs a,b,c. That's the reason. The B in daily haven't arrived yet. Just wait until it goes up to iv.

How about H4 chart?
Let's see the next post.

EURUSD Weekly Chart 2019 Part 2

This is my second part from my roadmap forecast. You can see my first part by clicking here.

Okay now for my weekly chart EURUSD, I can see more shortly than monthly time. When I see the smallest time frame, it'll more complex.

What I see in weekly chart EURUSD is like this.

EURUSD Roadmap Weekly Chart Elliot Wave

Remember the wave iii and iv in monthly chart my first post? Yes, with this I can see the small waves. The rules of waves is there's 5 waves up and 3 waves down in up trend... It's 1,2,3,5 for up and a,b,c for down.
The wave 3 is always the longest waves in normal condition. So when the waves arrived in wave 2, needs 5 more subwaves to get wave 3.

Look at my picture, the wave didn't arrive yet in sub waves (iv), we need to wait it until it comes then they will be arrived in sub waves (v) or I called it waves iii before the next step in wave iv.

What about daily chart? Don't worry, I'll post it too in next post.

Big Long Term Roadmap EURUSD 2019 Forecast Part 1

Every trader have they own forecast map, now I try to share to you my roadmap forecast. This is not the signals, just for education and my own diary story.

I will focused with EURUSD. I don't wanna trade another then this pairs, I don't know someday.. so I'll focus with this.

My roadmap forcast is using very big time frame. Yes, It's monthly chart.
I'm using Elliotwaves for my forecast.

Look at this my monthly roadmap

Elliot Waves EUDUSD Monthly Chart 2019

From this, the big waves that not shows is wave 4. Acatually, the wave 4 will be shows in e after abcde waves but, there's something unusual pattern. Look at the turquoise box, it's called irreguler pattern. The rules is wave c always more than wave a. What will be happened if wave c position is not more than wave a? The answers is no problem. It called Running flat wave. The wave c has 5 small waves. So we can see the next small wave is iii. It's not ended, still move, then goes up to iv and the final is wave c. I called the final c as big wave 4. It needs so long time.

Next I'll share my forecast in weekly chart in part2

Monday 2 November 2015

Ready To Catch

Dear diarytrading readers-

It's hot today in my country...

But I still focused to try to continue my analyze

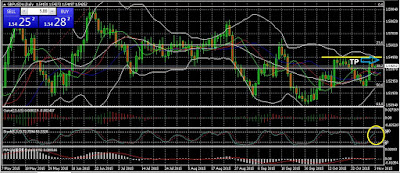
Ok for today still with daily chart GBP/USD check it out:

Ready to Catch


Sunday 1 November 2015

Are You Ready??

Dear diarytrading -

Remember what I post yesterday?

For details click here

I said that candlestick will move up based on ..

Okay, check this

Are You Ready?